
יום חמישי, 13 במרץ 2014
יום שלישי, 4 במרץ 2014
New ability : Reporting Services Activity Analysis
Hello Everyone,
I would like to share with you a new ability that I was a
partner in its development.
·
"What
is the status of my SSRS sites?”
·
“What is the total number
of reports that were executed (completed)?”
·
“How many reports were
executed per second on average?”
·
“Which reports are being served?”
·
“Which reports had errors?”
·
“Who are the most active
users? Which reports they run?”
·
“Which reports are most
requested, and by which users?”
·
“How many requests in total
were processed?”
·
“How many request in total
failed? And I want to be notified if a persisting issue is encountered …”
As a DBA and developer, who manages and develops various environments
of Reporting Services, I ask these questions every day... and some of them very
difficult to get the answer...
The popular database monitoring and analysis solution, Foglight
for SQL Server, now offers the capability of monitoring the status and activity
details of SQL Server Reporting Services (SSRS).
SQL Server Reporting Services a part of SQL Server solution,
which provides a central service that supports management, development, and
presentation of rich reports.
The reports are based on data derived from various database
types (Oracle, DB2, Excel, SQL Server and others).
The reporting services provide an optimized and parallel
processing infrastructure for processing and rendering reports.
Foglight for SQL Server allows analyzing the SQL Server
Reporting Services and produces detailed reports of the user’s activity.
Foglight for SQL Server supports the monitoring of SQL
Server Reporting Services at two levels:
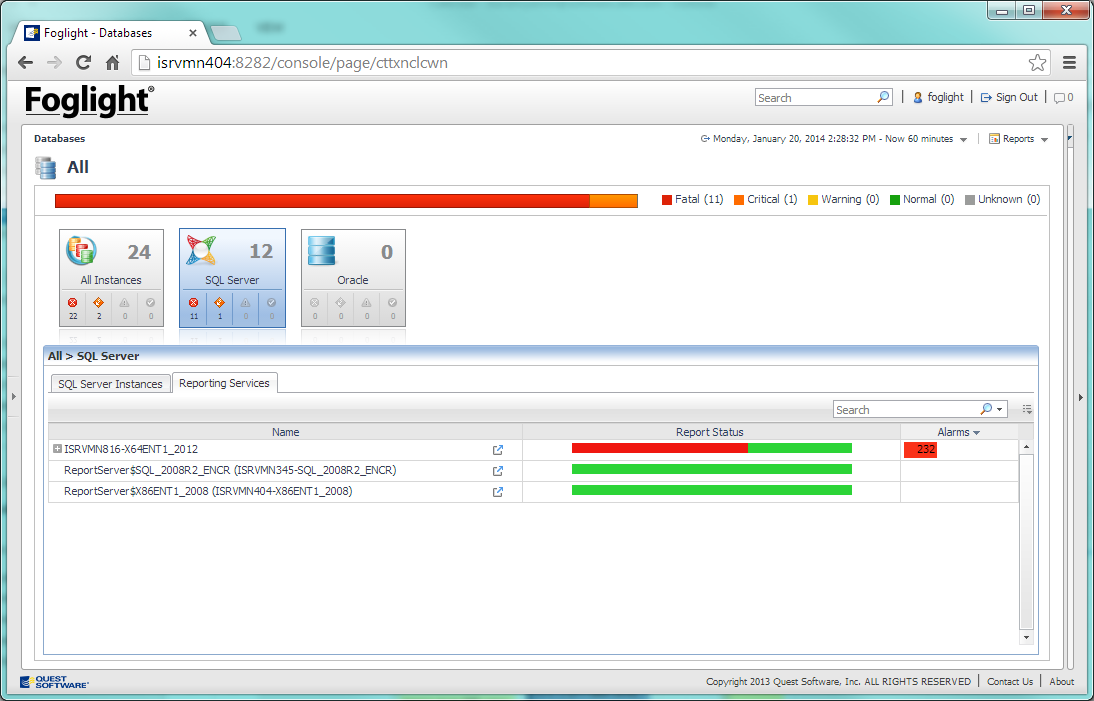
·
The Reporting Services
environment level – using the Reporting Services tab, which appears on the
Databases dashboard (Dashboards > Administration > Databases) when the
display is filtered to show only SQL Server instances.
In addition to the high-level analysis the
Reporting Services tab provides, you can also use it to review which reports
are being served, identify the reports that have errors, investigate the
reports activity within specific instances, and much more…
·
The instance level –
using the Services > Reporting Services panel. This panel shows the
Reporting Services configuration for the selected instance and provides
information about the reports that were run during the specified time range
(failed vs. successful runs, users who generated the highest number of reports
and so on).
You can also use this panel to view in-depth
information about the reports, such as the running time, the users who ran the
reports, and parameters used in each run…
For more details:
Enjoy!
הירשם ל-
רשומות (Atom)